Press ? for navigation help
Global Carbon Budget2021

Selected slides from the full powerpoint available here To download figures for use in your own presentations, visit this page Friedlingstein et al 2021; Global Carbon Project 2021
The global average CO2 concentration increased from ~277 ppm in 1750 to 415 ppm in 2021 (up 49%).
Globally averaged surface atmospheric CO2 concentration. Data from: NOAA-ESRL after 1980;
the Scripps Institution of Oceanography before 1980Source: NOAA-ESRL; Scripps Institution of Oceanography; Friedlingstein et al 2021; Global Carbon Project 2021
Perturbation of the global carbon cycle caused by anthropogenic activities, global annual average for the decade 2011–2020 (GtCO2/yr).
The budget imbalance is the difference between the estimated emissions and sinks.Source: NOAA-ESRL; Friedlingstein et al 2021; Canadell et al 2021 (IPCC AR6 WG1 Chapter 5); Global Carbon Project 2021
Global fossil CO2 emissions: 34.8 ± 2 GtCO2 in 2020, 53% over 1990.
Projection for 2021: 36.4 ± 2 GtCO2, 4.9% [4.1%–5.7%] higher than 2020.
The 2021 projection is based on preliminary data and modelling.Source: Friedlingstein et al 2021; Global Carbon Project 2021
Global fossil CO2 emissions are projected to increase by 4.9% [4.1%–5.7%] in 2021.
The 2021 projections are based on preliminary data and modelling.Source: Friedlingstein et al 2021; Global Carbon Project 2021
The global atmospheric CO2 concentration is forecast to average 415 parts per million (ppm) in 2021, increasing by 2.0 ppm.
Source: Friedlingstein et al 2021; Global Carbon Budget 2021
Emissions are expected to increase in most countries in 2021, with the largest increase in China, USA, and India.
Figure shows the top four countries contributing to emissions changesSource: Friedlingstein et al 2021; Global Carbon Project 2021
Share of global fossil CO2 emissions in 2020: coal (40%), oil (32%), gas (21%), cement (5%), flaring and others (2%, not shown).
Projection by fuel type is based on monthly data (GCP analysis).
Global emissions in 2020 dropped across all categories.
In 2021 coal and natural gas have more than recovered this loss, while oil still lags from subdued transportation.
Emissions by category from 2000 to 2020, with growth rates indicated for the more recent period of 2015 to 2020.
Coal use has declined since 2014, and both coal and oil declined sharply in the pandemic year 2020.
Annual emissions in China are expected to reach another record high in 2021, with substantial industrial growth.
The USA’s emissions from coal are expected to bounce back in 2021, partly as a result of supply constraints on natural gas. Emissions from oil do not return to 2019’s level.
Source: EIA 2020; Friedlingstein et al 2021; Global Carbon Project 2021
In the first half of 2021 EU coal power generation was strong due partly to very low generation from wind power, but the 2021 total is expected to remain below 2019’s level and continue to decline.
India’s emissions are expected to jump sharply in 2021, returning to a strongly growing trend driven largely by use of coal in power generation.
In the Rest of the World, emissions from coal and natural gas are expected to recover most of their losses in 2020.
Oil, which here includes internationship transport, remains subdued.
The Rest of the World is the global total less China, US, EU, and India. It also includes international aviation and maritime shipping.Source: Friedlingstein et al 2021; Global Carbon Project 2021
The production of cement results in ‘process’ emissions of CO2 from the chemical reaction.
During its lifetime, cement slowly absorbs CO2 from the atmosphere.
Consumption of energy from fossil sources declined in 2020.
Renewable energy continued to grow, but needs to grow even faster to replace fossil energy consumption.
This figure shows “primary energy” using the BP substitution method
(non-fossil sources are scaled up by an assumed fossil efficiency of approximately 0.38)Source: BP 2021; Global Carbon Project 2021
Energy consumption by fuel source from 2000 to 2020, with growth rates indicated for the more recent period of 2015 to 2020.
This figure shows “primary energy” using the BP substitution method
(non-fossil sources are scaled up by an assumed fossil efficiency of approximately 0.38)Source: BP 2021; Global Carbon Project 2021
Coal consumption in energy units has returned to peak levels, while consumption of all other energy sources is growing strongly.
Source: BP 2021; Global Carbon Project 2021
Coal consumption has declined sharply in recent years with the shale gas boom and strong renewables growth. Output from nuclear power is slowly declining as stations are retired.
Source: BP 2021; Global Carbon Project 2021
Consumption of both oil and gas has rebounded in recent years, while coal continues to decline.
Renewables are growing strongly, now providing more energy than nuclear power.
Source: BP 2021; Global Carbon Project 2021
Pandemic year 2020 has interrupted India’s strong growth in energy consumption.
Consumption of coal and oil dominate.
Source: BP 2021; Global Carbon Project 2021
Land-use change emissions are 4.1 ± 2.6 GtCO2 for 2011-2020, and show a negative trend in the last two decades, but estimates are still highly uncertain.
Estimates from three bookkeeping modelsSource: Friedlingstein et al 2021; Global Carbon Project 2021
Net land-use emissions are the difference between CO2 emissions, primarily from deforestation, and CO2 removals, primarily from abandonment of agricultural land.
Estimates from three bookkeeping modelsSource: Friedlingstein et al 2021; Global Carbon Project 2021
Carbon emissions are partitioned among the atmosphere and carbon sinks on land and in the ocean.
The “imbalance” between total emissions and total sinks is an active area of research.
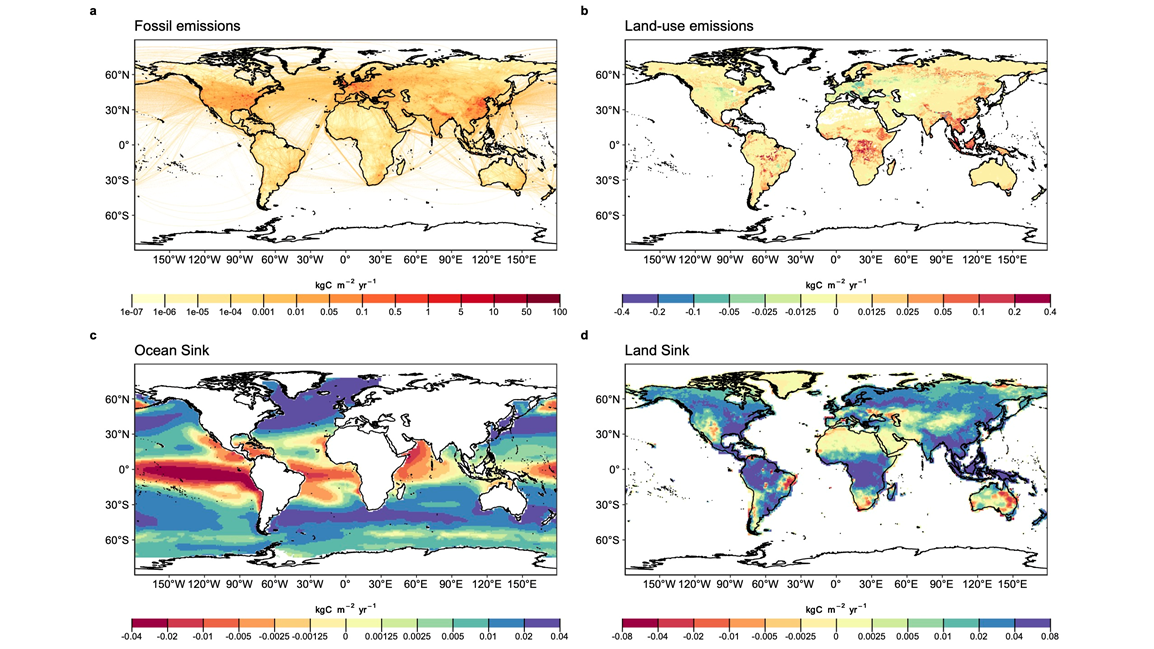
Fossil emissions dominate in the Northern Hemisphere, while land-use emissions are important in the tropics.
The North Atlantic and Southern Ocean are carbon sinks while the tropical ocean is a source of CO2.
Tropical, temperate and boreal forest are the main terrestrial carbon sinks.
The atmospheric concentration growth rate has increased steadily.
The high growth in 1987, 1998, & 2015–16 reflect a strong El Niño, which weakens the land sink.
The ocean carbon sink, estimated by Global Ocean Biogeochemical Models and observation-based data products, continues to increase 10.2 ± 1.5 GtCO2/yr for 2011–2020 and 11.0 ± 1.5 GtCO2/yr in 2020.
Source: SOCATv2021; Bakker et al 2016; Friedlingstein et al 2021; Global Carbon Project 2021
The land carbon sink, estimated by Dynamic Global Vegetation Models, was 11.2 ± 2.2 GtCO2/yr during 2011–2020 and 10.7 ± 3.6 GtCO2/yr in 2020.
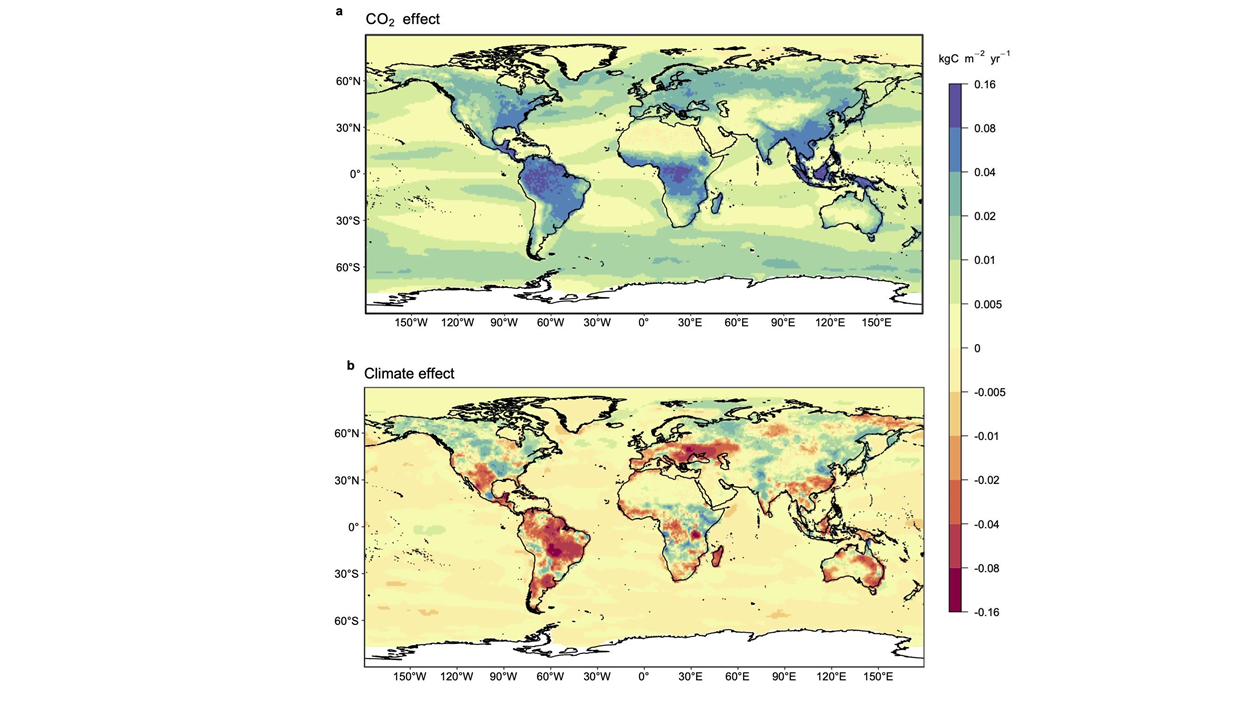
Process models suggest that increasing atmospheric CO2 drives the land and ocean sinks while climate change reduces the carbon sinks; the climate effect is largest in tropical and semi-arid land ecosystems. Globally during the 2011-2020 decade, climate change reduced the land sink by ~15% and the ocean sink by ~5%.
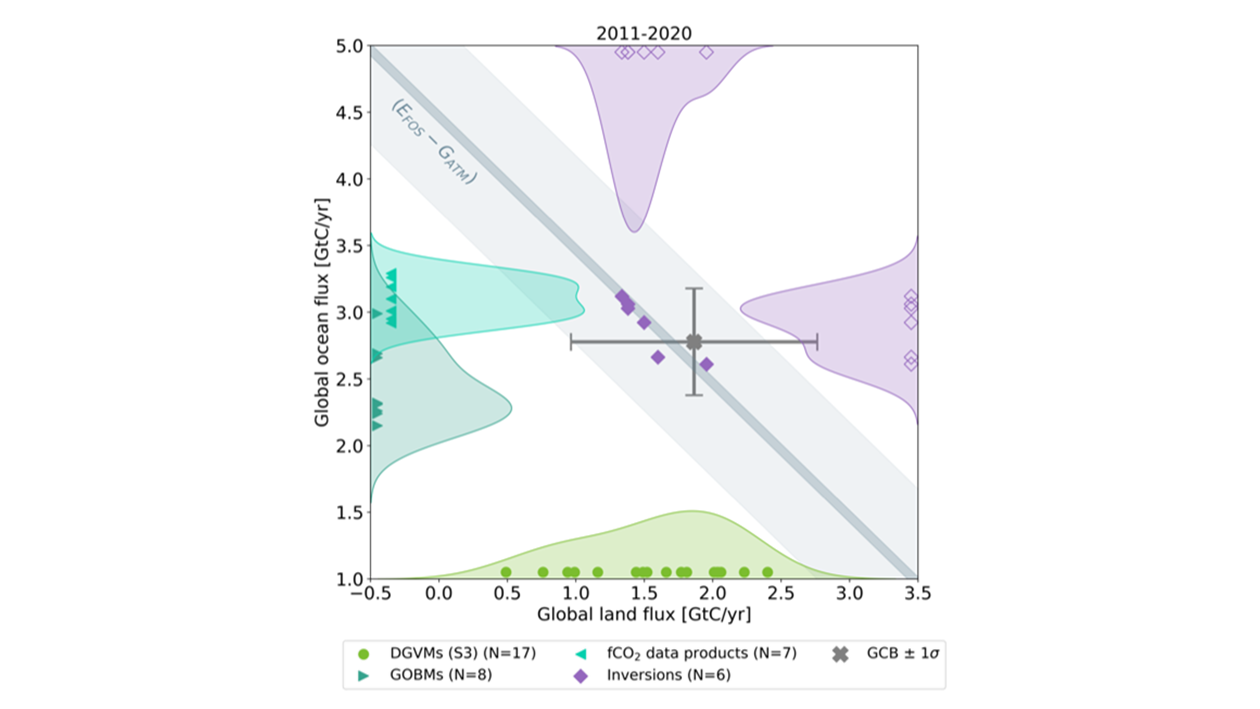
Atmospheric CO2 inversions allow the estimation of the land and ocean carbon fluxes independently from the land and ocean process-based model estimates, confirming the global carbon budget estimates of the land and ocean partitioning of anthropogenic CO2.
Large and unexplained variability in the global carbon balance caused by uncertainty and understanding hinder independent verification of reported CO2 emissions.
The budget imbalance is the carbon left after adding independent estimates for total emissions, minus the atmospheric growth rate and estimates for the land and ocean carbon sinks using models constrained by observationsSource: Friedlingstein et al 2021; Global Carbon Project 2021
The cumulative contributions to the global carbon budget from 1850.
The carbon imbalance represents the gap in our current understanding of sources & sinks.
The remaining carbon budgets to limit global warming to 1.5°C , 1.7°C and 2°C are 420 GtCO2, 770 GtCO2, and 1270 GtCO2 respectively, equivalent to 11, 20 and 32 years from 2022.
2475 GtCO2 have been emitted since 1750.
Quantities are subject to [additional] uncertainties e.g., future mitigation choices of non-CO2 emissionsSource: IPCC AR6 WG1; Friedlingstein et al 2021; Global Carbon Budget 2021
Contributors